Picture this: you’re six months into a longitudinal mouse study measuring 6-Hydroxydopamine (6-OHDA) with a Mouse 6-OHDA ELISA Kit. Your first batch of samples ran beautifully on the kit you ordered back in January. Now it’s July, that original kit has been sitting at 4°C, and you’ve just received a fresh shipment from the same supplier. Same catalog number, same ELISA test kit — but is it truly the same performance? Will your July data seamlessly append to your January data, or are you about to introduce a silent batch-shift that will haunt your statistical analysis?
This anxiety is universal among ELISA users, and it has a name: lot-to-lot variability, or inter-assay CV. As a leading elisa kit manufacturer based in China, Yanda Bio fields this question constantly. In this article, we’ll give you a practical, quantitative method to assess lot-to-lot consistency yourself, explain what CV values are acceptable, and highlight the operational details that can mimic poor lot-to-lot performance even when the kits are perfectly fine.
Why Lot-to-Lot Consistency is the Real Measure of an ELISA Kit Supplier
Anyone can produce one good batch. The true test of an elisa diagnostic kit supplier in China — or anywhere — is whether batch #23 performs identically to batch #1. For studies spanning months or years (vaccine trials, disease progression monitoring, breeding colony surveillance), switching kits mid-stream without verifying consistency risks generating data that cannot be pooled.
The good news? Judging lot-to-lot consistency doesn’t require a statistician. With one shared sample and a few hours at the bench, you can quantify it yourself.
A Simple Protocol to Compare Two ELISA Kit Lots
When you have an old kit (Lot A) and a new kit (Lot B) targeting the same analyte, follow this streamlined comparison:
Step 1: Prepare a Shared Sample
Take one representative biological sample — ideally a pooled serum, plasma, or tissue homogenate from your study species — that falls within the middle-to-upper range of the standard curve. Aliquot it so you have identical material for both kits. Avoid using a sample at the very bottom or top of the curve, where resolution is poorest.
Step 2: Run the Standard Curve on Both Kits Simultaneously
On the same day, with the same pipettes and the same incubator, run the full standard curve from Lot A and Lot B side-by-side. Use the shared sample as an “unknown” in duplicate or triplicate on each plate.
Step 3: Compare Three Things Visually
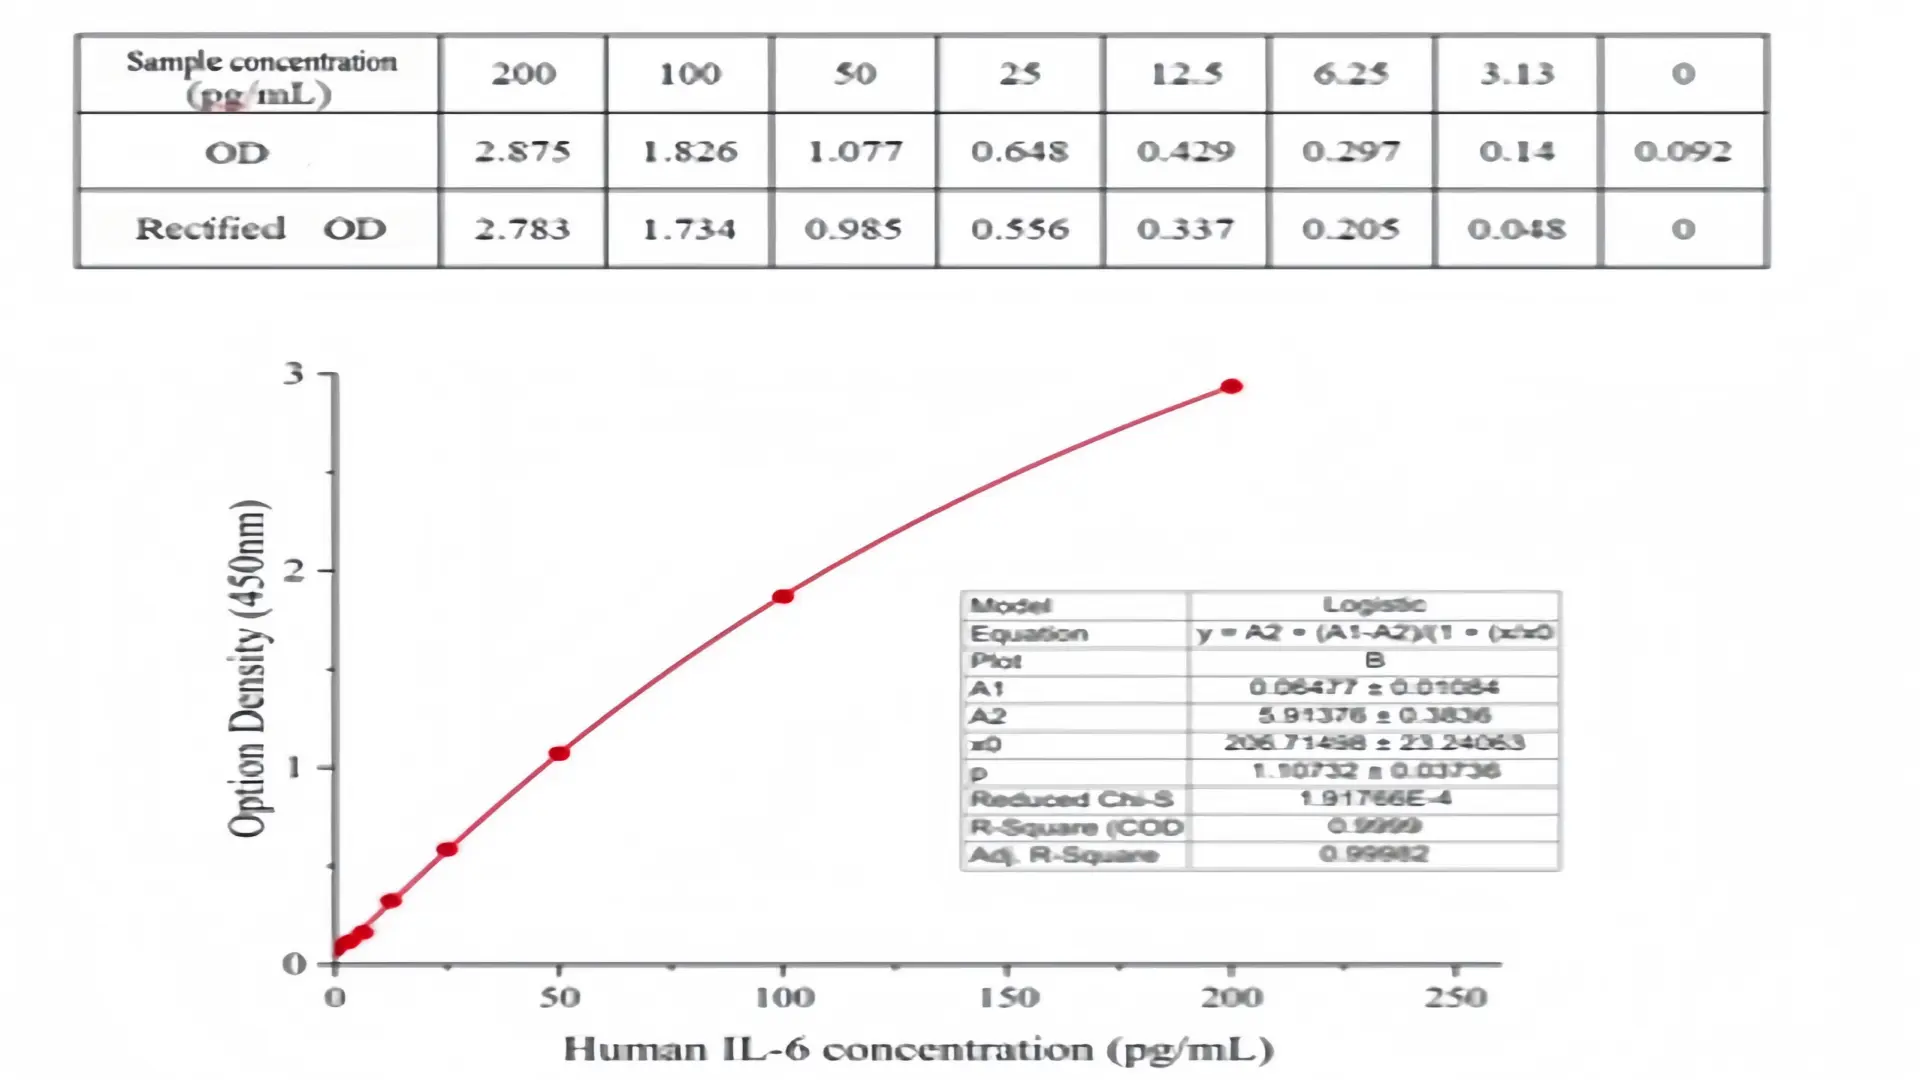
- The top OD (the highest standard): If one kit’s top OD is 2.8 and the other’s is 1.9, something has shifted — possibly antibody titer or HRP activity.
- The background (blank/zero standard): A sudden jump in background OD (e.g., from 0.05 to 0.15) suggests a reagent issue or incomplete washing.
- The shape of the curve: The curves should overlay nicely across the entire dynamic range, not just at the top and bottom.
If the visual check raises a red flag, don’t automatically blame the kit — but definitely quantify it.
The Quantitative Gold Standard: Coefficient of Variation (CV)
The coefficient of variation (CV) is the ratio of the standard deviation to the mean, expressed as a percentage. In ELISA, we talk about two types:
Intra-Assay CV (Within-Run Precision)
This is the variation you see when you run the same sample multiple times on the same plate, using the same lot. It reflects pipetting precision, washing uniformity, and incubation consistency.
Industry benchmark:
- Good: < 10%
- Tight: < 8%
- Yanda Bio’s standard: Our kits routinely deliver intra-assay CV within 5%. We achieve this through automated liquid handling during coating and stringent QC on every single plate.
Inter-Assay CV (Lot-to-Lot or Run-to-Run Precision)
This is the variation you see when you run the same sample on different plates, potentially from different lots, on different days. This is the number you really care about for longitudinal studies.
Industry benchmark:
- Acceptable for most quantitative assays: < 15%
- Strict (ideal for regulated or publication-quality work): < 10%
- Very strict (pharma-grade): < 8%
Yanda Bio’s inter-assay CV for immunoglobulin and specialized ELISA kits: We target 7–10% across different analyte panels. This is validated by running a panel of natural and recombinant samples on three independent lots and confirming that the measured concentration does not drift outside the 90–110% recovery window.
How to calculate it yourself:
- Run your shared sample on Lot A and Lot B (ideally in triplicate).
- Calculate the mean and standard deviation of the back-calculated concentrations.
- CV (%) = (Standard Deviation / Mean) × 100
If your CV is under 10%, your two lots can be treated as interchangeable for most research purposes. Between 10–15%, you may need to apply a correction factor or run a bridging study. Above 15%, contact your supplier — the kit may genuinely have a lot-shift issue, or it may have been stored improperly in transit.
When “Bad Lot-to-Lot Performance” is Actually an Operational Problem
Here’s a scenario we’ve seen repeatedly: a customer tests two lots, finds wildly different results, and concludes the kits are inconsistent. Then we walk through their protocol and discover the culprit isn’t the kit at all.
The incubator edge effect. Most lab incubators use a fan to circulate warm air. If you place your ELISA plate directly against the incubator wall or too close to the fan outlet, the wells in the direct airflow path warm up faster and experience higher evaporation rates than the wells on the periphery. The result? The center wells show accelerated enzyme kinetics — higher OD, higher apparent concentration — while the edge wells lag behind. This creates a spatial pattern on the plate that looks exactly like poor lot-to-lot consistency when you compare plates that were positioned differently in the incubator.
The fix: Always seal your plate with an adhesive film during incubations. If your protocol allows, wrap the plate in aluminum foil to create a thermal buffer. Position the plate in the center of the incubator shelf, not against the walls. And always, always keep a detailed lab notebook entry of where the plate sat — you’d be surprised how often this tiny variable explains “unexplained” inter-assay CV.
Other common mimics of lot-to-lot variability:
- Using pipette tips that are not pre-wetted, leading to inconsistent aspiration.
- Incomplete mixing of frozen samples after thawing.
- Reusing wash buffer that has sat at room temperature for days.
- Storing kits unsealed in a frost-free freezer (repeated freeze-thaw cycles degrade reagents).
Before you conclude a kit is bad, audit your own workflow. A high-quality ELISA test kit from a reputable elisa kit manufacturer will perform consistently when handled correctly. The operational variables listed above are responsible for a significant fraction of “kit problems” reported to technical support teams.
Why Yanda Bio’s ELISA Kits Are Built for Consistency
At Yanda Bio, we don’t just hope our kits are consistent — we design them to be. Here’s what that means in practice:
- Raw material locking: Once a capture-detection antibody pair is validated, we secure enough raw material from a single lot to cover months of production. This eliminates antibody-sourcing drift, the #1 cause of lot-to-lot shifts.
- Automated plate coating: Our robotic liquid-handling systems coat every well with identical volumes of capture antibody, eliminating the manual pipetting variation that plagues small-scale production.
- Accelerated stability testing: Every new lot is subjected to real-time and accelerated stability protocols (e.g., 37°C for 7 days) to ensure that enzyme conjugates and standards won’t degrade under normal shipping and storage conditions.
- Multi-lot bridging: Before releasing any lot, we run it head-to-head against the previous two lots using a panel of characterized samples. Only when CV is within our 7–10% specification does the lot ship.
And because we’re a China-based elisa diagnostic kit supplier in China with in-house manufacturing, we pass the cost savings directly to you. Whether you need one IgG ELISA kit for a pilot study or 500 kits for a multi-center trial, our wholesale pricing is among the most competitive you’ll find — without sacrificing the accuracy and reproducibility your research demands.
The Bottom Line
Lot-to-lot consistency isn’t a black box. With one shared sample, a quick standard curve comparison, and a simple CV calculation, you can quantitatively determine whether your old and new kits are giving you the same answer. Keep your intra-assay CV below 8% and your inter-assay CV below 15% (ideally below 10%), and watch out for the hidden operational variables — especially incubator placement — that can masquerade as kit problems.
If you’re looking for a partner that takes batch-to-batch reproducibility as seriously as you do, explore our product pages:
- [IgG IgA IgM ELISA kit] – validated for mouse, rat, human, and more
- [elisa kit manufacturer] in China – learn more about our quality systems and OEM capabilities
Have a question about lot-to-lot bridging or need a sample kit to test for yourself? Reach out to our technical team. We’d rather spend an hour on a video call helping you optimize your protocol than have you lose months of data to an avoidable variable.
Yanda Bio — accurate, affordable, and engineered for consistency.